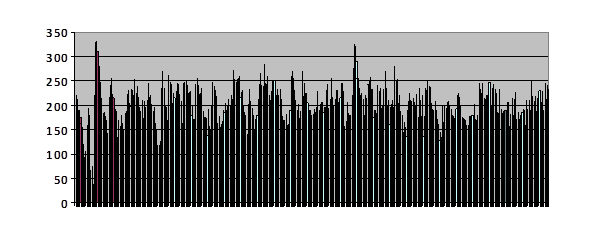
Each vertical line is a simulated generation with a height which is proportional to the number of offspring in that generation. Each generation, offspring were removed at random down to the maximum to which the population was limited. If the number of offspring was less than that limit, none were removed. The horizontal axis is generations.
Fig. 41
The population limit was, I think I remember, 100.
I had done a run in which the population was limited to 200, and saved them. Then I pulled 100 out of the recorded virtual individuals and let it run. There was a brief hiccup during which the number fell below 100 followed by a later corresponding peak. After that the number varies a great deal – looks very noisy – but I recognize no overall pattern.
Now, quite fortunately, I can offer you some real-world data in figure 41.
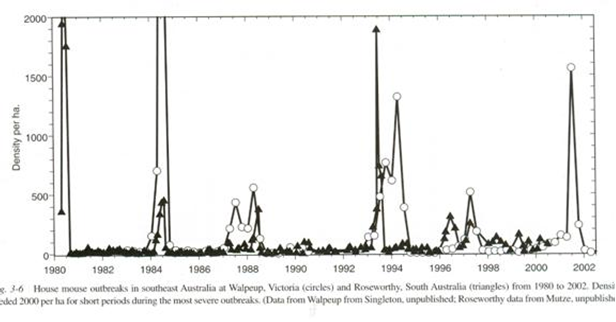
Serial counts of wild mice were periodically made at two stations in southern Australia. The vertical axis is the number of mice per hectare; the horizontal axis is the dates of the counts.
Fig. 42 22
The book I found this in, The Mouse in Biomedical Research, is several volumes long. Much of it is beyond me, but the chapter by Singleton and Krebs is charming and most helpful. In Australia and New Zealand there are periodically plagues of mice during which their numbers increase greatly. They have counting stations where they record mouse numbers. The graph shows counts from two such stations. Plagues will frequently follow a drought. During a plague, numbers rise very high and very fast. At other times the numbers are low and rather stable.
I am not entirely happy with my computer run in a couple of regards. In the simulation, numbers are rather stable but this is because a hard ceiling is in place – a limit to population size. So that proves nothing. But the initial dip and rise are persuasive. Similarly, the fact that plagues follow droughts suggests that numbers are reduced by a drought leading to the same rebound the computer run shows. But when I look at the mouse data we are given, I do not see such a reduction in numbers. Perhaps looking at the raw data would show it, but I cannot make it out in the graph. Similarly, the authors make mention of the fact that at the end of a spike mice are very rare indeed; I suppose this is evident in the raw numbers. I shall call the spike and fall a single cycle event.
The most conspicuous feature is the occasional single cycle event around 1980 and 1984 for instances. The authors found the rapid rise and abrupt rapid fall to be puzzling, particularly the fall. They discounted the possibility that the mice were feeling crowded and fighting and killing each other; injuries were no more common than usual. They discounted the notion that the mice had increased past what the environment could hold; there was always ample food even at the top of the highest peak. They discounted the notion that the fall was due to increased loss to predators; there were at the height so many mice that if all available predators ate nothing else, they simply could not have stuffed enough mice down to have a significant impact. The authors conclude that there may have been infectious epidemics, arriving right on schedule, a sort of a plague plagues, but they did not in fact find any such pathogen.
The thing I find exciting is that on two occasions we see a double peak for all the world like the population peaks in the Long House Valley experience. These occur around 1988 and 1994. At first glance it may look like there are three such double peaks, but in fact that is the fortuitous juxtaposition of spikes at the two different counting stations. The second spike each time is higher than the first. This is the hallmark of strengthening oscillation we are familiar with.
What I cannot easily explain is why the European voles show the same conspicuous damped oscillation as the laboratory raised fruit flies, but the mice here never seem to show such a damped oscillation. In fact, in all my travels, I have never seen a population that demonstrated both strengthening oscillation and damped oscillation; it seems to be species specific. I hope to return to this point and make a suggestion after we have looked at laboratory bred mice and Japanese quail. Perhaps somebody defter than I can use my source code, available above now and to be discussed also below, and give a more plausible demonstration of a stable baseline, but a glance at the wild mouse survival pattern does show that usually there is a low and stable baseline, suggesting a wholesome balance between inbreeding depression and outbreeding depression. I have not been able to reproduce this in cyberspace. Nature evidently has better resources than I and more time.
In 1973 a man named J. Calhoun published what I regard as the classical study. He built a large cage for mice with plenty of nesting places and material and assured there would be plenty of food and water; then he released four males and four females in the cage. He observed their behavior and counted them periodically. This was not the first time he had done such an experiment. His results were consistent. Figure 43 is how this population changed over time.
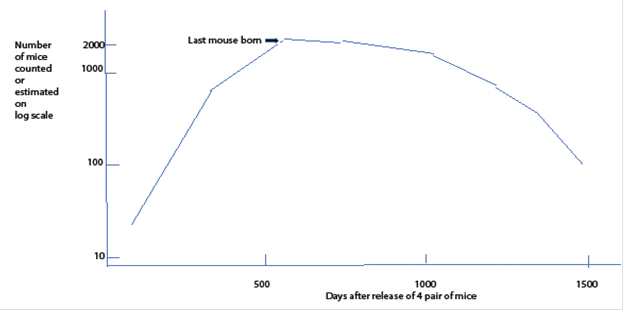 Mouse numbers in a cage provided with all mouse needs. The vertical axis the number of mice in the cage on a logarithmic scale. The horizontal axis is time in days after since the first release of mice into the cage.
 Fig. 43 23
Obviously, the population grew explosively until it reached almost one thousand mice. Then it grew more slowly to about two thousand. Then sometime between day 500 and day 600 all live births ceased, never to return. Unlike some previous data sets in which the size of the population had to be inferred from survivability or evidence of cook fires, these are counts in a laboratory. I should not have been sorry if the counts had been done more frequently, particularly around the beginning of the experiment, but the pattern is clear: one rise, one fall, extinction. This is a single cycle event.
On day one thousand five hundred, he ended the study; there had been no live births for a long time, and the mice were all too old to reproduce anyway. At one point after the last live birth he removed a few males and placed them with females known to be fertile. The males took no interest in the females, and there were no babies. In other words, males raised in the cage after a number of generations experienced absolute infertility. I am not sure whether it was post-zygotic (males hard wired for abnormal behavior) or pre-zygotic (sperm never getting to ova) or both.
There may be a clue in their behavior, which he carefully described. For one thing, the mice promptly showed a preference for one corner of the cage, choosing to use nesting boxes there until all the boxes were filled and on the two adjacent sides the number of boxes occupied dropped steadily and continue to drop past the two corners. The corner farthest from the preferred corner never had any boxes occupied at all. The temptation is very strong to interpret this to mean that the mice were showing a preference of high status both in location choice and mating choices.
As the mice become more crowded most of the unattached males would stay gathered in the center of the cage. When one left to eat or get a drink of water it would be attacked when it returned. Some of the males – Calhoun calls them the “beautiful ones” – neither competed for females nor entered the brawling world of the disappointed males. Instead they would get away from all the others and spend their time grooming. Again, there is a strong temptation to liken them to young urban male humans who, at a time of low reproductive rate, may largely withdraw from social contact. The evidence is anecdotal, and in the absence of valid numbers it seems hard to draw conclusions.
Now think again about the mouse plague data we saw above.
As I mentioned earlier, the populations tend to be small and stable in a fashion I have not had much success in getting my model to give. Since my source code is available through nobabies.net I invite anyone to have a go at it.
Something that is not visible is the damped oscillation pattern shown by my fruit flies and by European voles. Then there is the double peak pattern, strengthening oscillation, I also described, which appears to be something that humans have a distinct tendency to follow. It seems odd that mice and humans share a pattern that we do not share with flies or voles. Voles, like mice, are rodents. Yet they do not share the same patterns, at least not conspicuously. We shall have to return to this point. As I said, whether there is damped oscillation, or strengthening oscillation with possible single cycle events appears to be species specific.
Regarding the single cycle pattern. In normal times a male mouse will be very territorial, defending its little domain and its females most fiercely. But during a plague they seem to give up keeping all those others out; other males can pass with impunity. What I suspect is that during the high population peaks, the fertility of the mice drops to zero, just as in Calhoun’s cage. The rapid fall may be due to the fact that life in the wild is a lot more difficult than in Calhoun’s friendly cage. The brawling in the cage is not described among the plague mice, but surely the crowding even in the biggest plagues cannot be anything like the crowding in the cage.
I suspect the rapid fall is related to the behavior of Calhoun’s “beautiful ones.” If they can’t be bothered to defend their territory, they may not put the effort in to scour around and find something to eat – something my mother used to call “survival value.” They may be starving in the midst of plenty.
I do not know; I only suspect. And I don’t have a suggestion of how to find out. But one thing is perfectly clear: the plague mice tend to show the same single cycle as Calhoun’s mice and the infertility is post-zygotic at least.